

Cash flow, not just profit margin, dictates your retail survival. Your bedsheet stock turnover ratio measures how efficiently capital moves through inventory: Turnover = COGS ÷ Average Inventory Value, with 4-6 turns per year considered healthy for home textile retail. Use ABC inventory categorization — Sanganeri as 'A' volume drivers, Bagru as 'B' mid-tier, Hand Block as 'C' premium/low-volume — to match stock to real demand and start preventing dead stock textiles from freezing your capital. Fast moving vs slow moving SKUs need different reorder rules entirely. Low MOQ wholesale bedsheets Jaipur sourcing lets you run lean with smaller, more frequent batches. WhatsApp 9549322035 and order a low-MOQ mixed lot to test your market velocity.
What This Guide Covers
Cash flow, not just profit margin, dictates your retail survival. A retailer can be profitable on paper and still run out of cash if too much capital is sitting frozen in unsold stock. Bedsheet stock turnover ratio is the single number that reveals whether your capital is moving efficiently through inventory or quietly stuck on a shelf — and improving it is one of the fastest ways to free up cash without a single additional sale.
The Turnover Math
How to calculate inventory turnover retail businesses actually use comes down to one formula, applied consistently:
Average inventory value is your beginning plus ending inventory value for the period, divided by two. Once you have your turnover ratio, dividing 365 by that number gives you Days on Hand — the average number of days a piece of stock sits before it sells.
Worked Example
| Category | Home Textile Industry Benchmark |
|---|---|
| Overall home textile retail | 4–6× annually |
| Fast-moving entry-tier SKUs | Can comfortably exceed 6× |
| Premium/specialty craft products | 3–5×, slightly lower is normal |
This benchmark exists for a reason: too low, and capital sits idle; too high, and you risk stockouts during demand spikes. 4-6 turns per year is the range most home textile retailers should aim for as a baseline.
Get wholesale pricing to plan your turnover calculation
WhatsApp Now →ABC Inventory Categorization
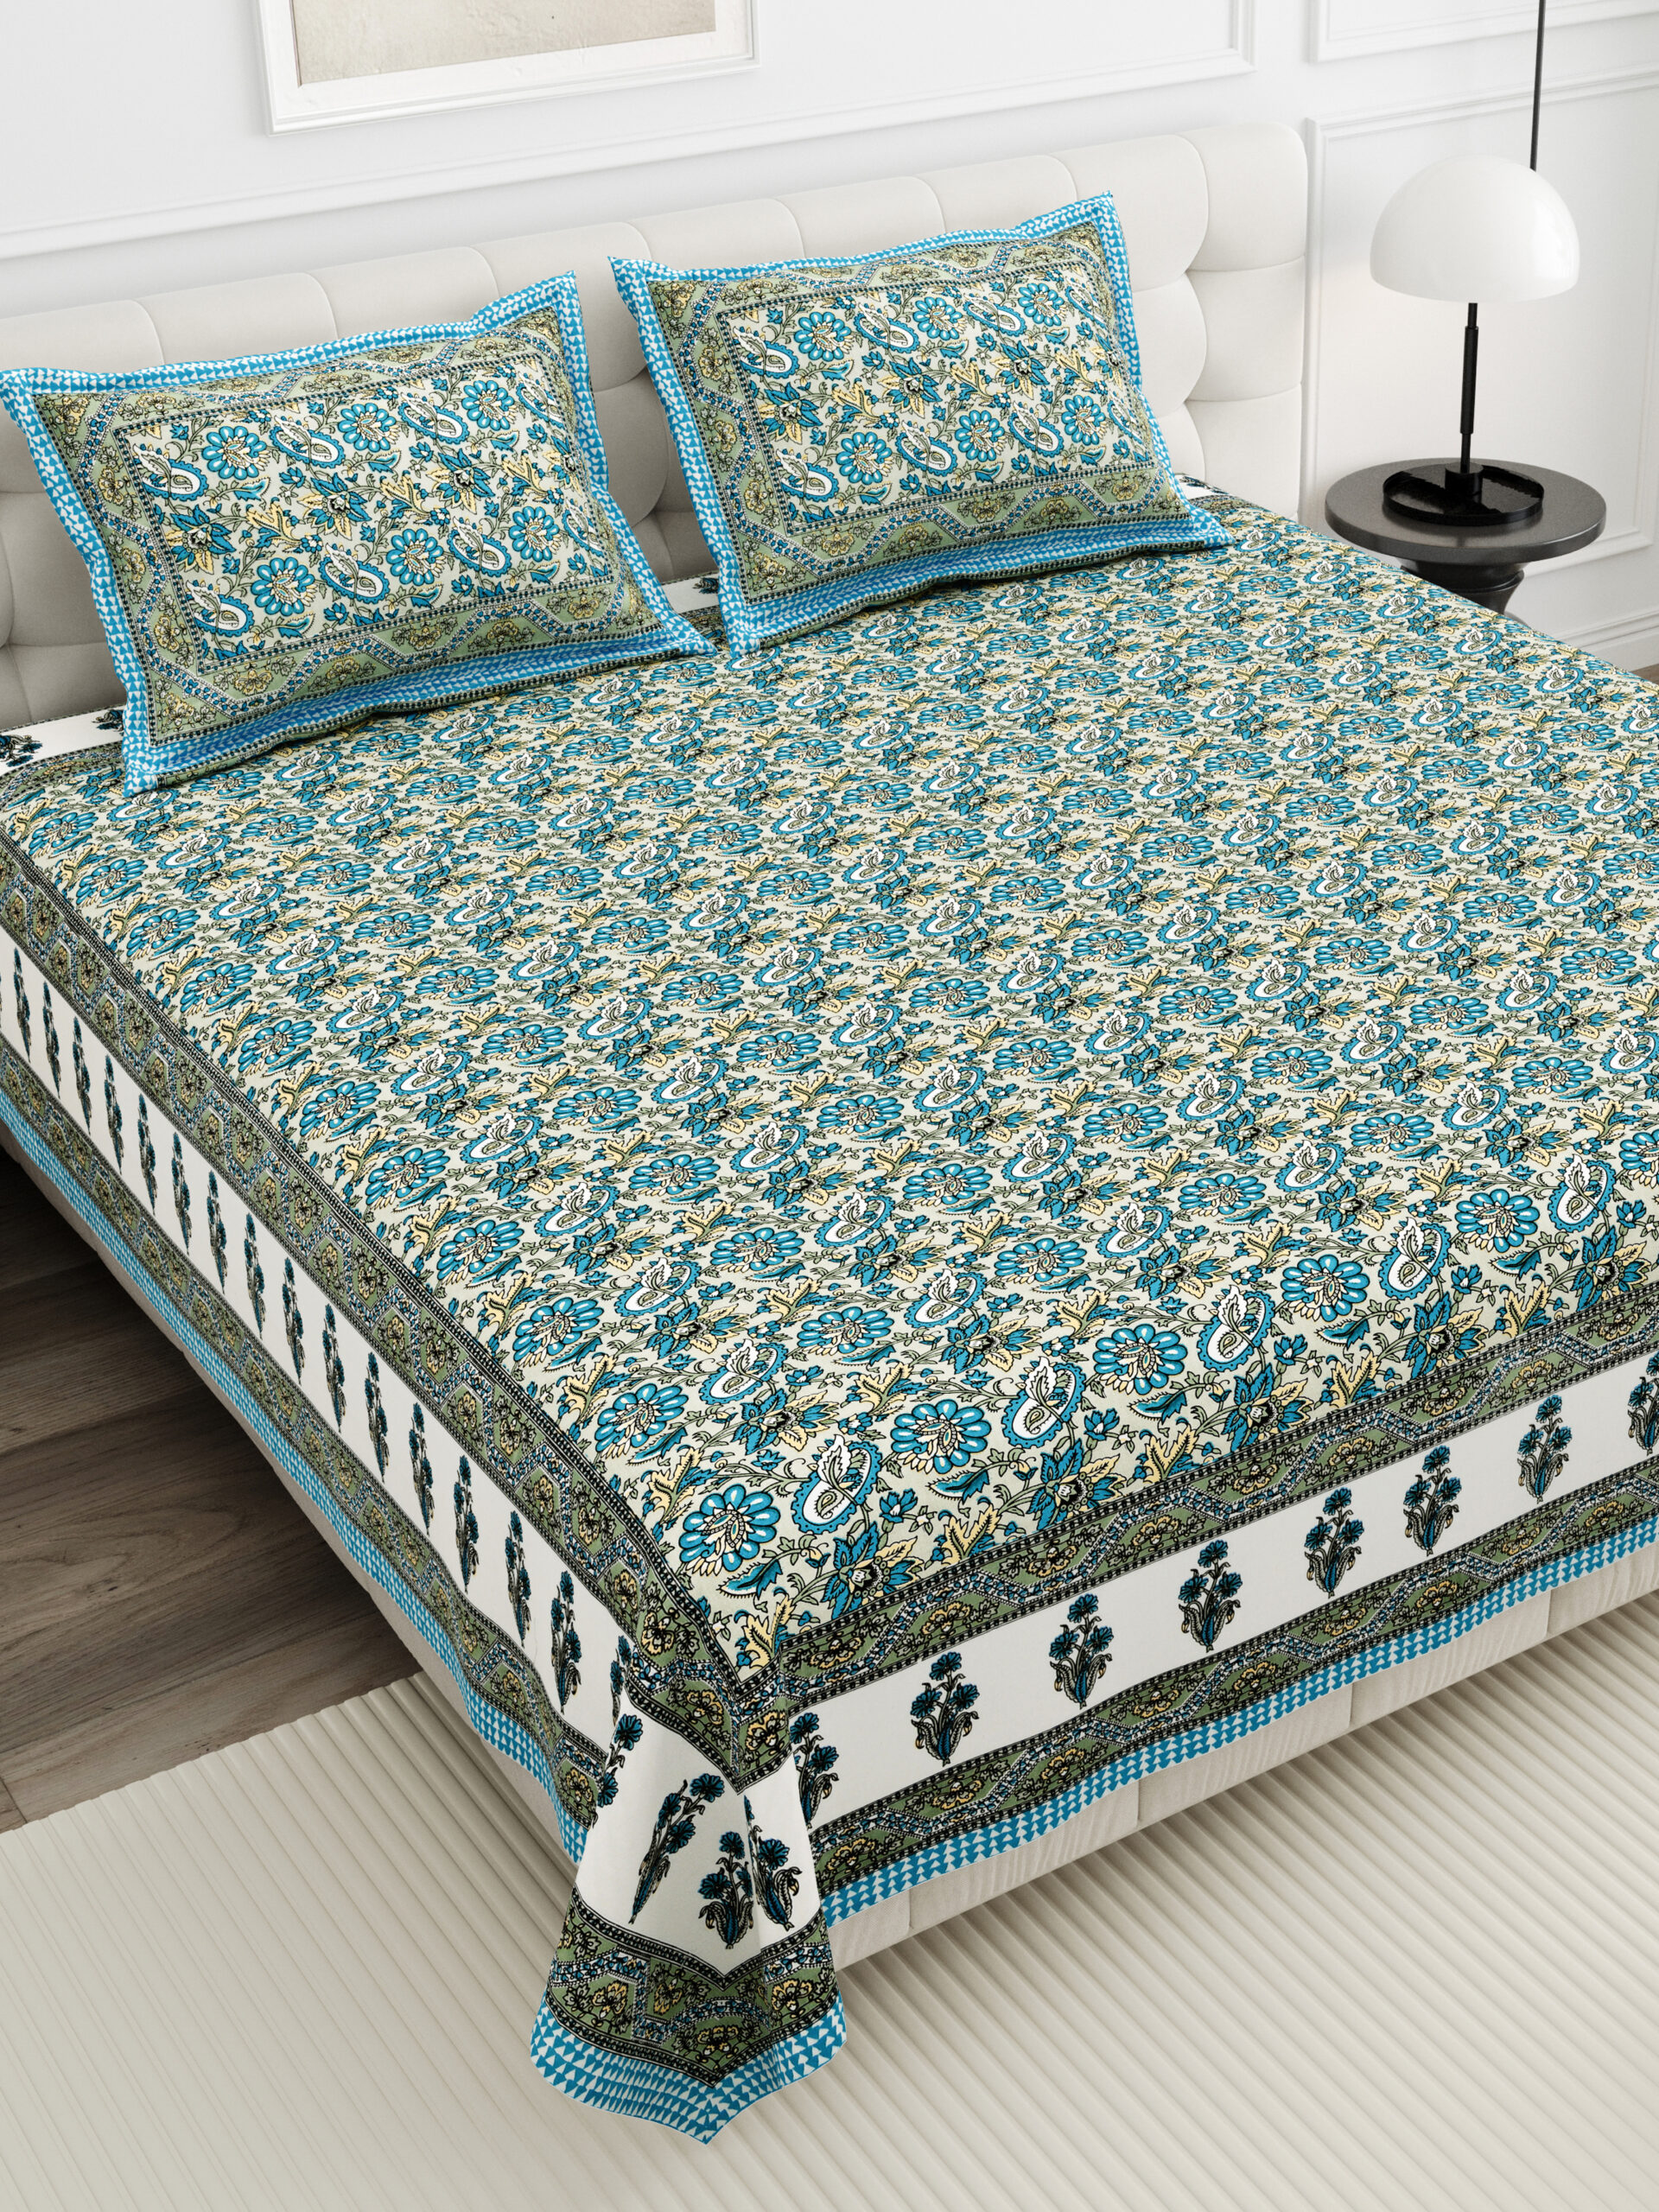
Not every SKU deserves the same stock allocation. ABC categorization maps your Jaipur print range directly to stock velocity, distinguishing fast moving vs slow moving SKUs so you can allocate capital where it actually turns over.
| Category | Sales Velocity | Reorder Strategy | |
|---|---|---|---|
| A | Sanganeri | High volume | Frequent, larger batches |
| B | Bagru | Moderate volume | Consistent, mid-sized batches |
| C | Authentic Hand Block | Low volume, premium | Minimal stock, made-to-order |
This isn't a permanent label — a print can move between categories as demand shifts. Review your ABC breakdown every 3-6 months using real sales data, not assumptions about which print "should" sell well.
The Dead Stock Trap
Preventing dead stock textiles starts with resisting one specific temptation: over-ordering an unproven SKU just to cross a minor bulk discount threshold.
Why the "Just a Little More for the Discount" Trap Hurts Growth
Saving 3-5% on a per-piece price by ordering double the quantity of an unproven print sounds efficient — until that extra stock doesn't sell. The capital tied up in unsold Category C inventory isn't earning you anything; it's frozen, unavailable for reinvestment in your proven Category A sellers, and it directly drags down your overall turnover ratio. A small percentage discount rarely offsets months of a SKU sitting dead on a shelf.
Test unproven prints in small batches first. Only scale a Category C item into a larger order once it demonstrates genuine sell-through — not because the per-piece price looked attractive at a higher quantity.
How Your Supplier Impacts Your Ratio
Your turnover ratio isn't only a function of your own sales performance — it's also shaped by how your supplier lets you order. A supplier demanding large minimum order quantities forces you to hold more average inventory than your actual sales velocity justifies.
Low MOQ Wholesale Bedsheets Jaipur — Built for Faster Turnover
We offer low MOQs, mixed lots across Sanganeri, Bagru, and Dabu prints in a single order, and fast Sanganer-direct dispatch — all specifically because these let retailers keep less inventory on hand at any given time and turn what they do hold faster.
Instead of committing to a single large batch of one print to hit a trader's minimum, a mixed lot lets you test multiple SKUs simultaneously in small quantities, then reorder only what proves to be Category A or B — directly supporting the ABC strategy above.
Because we manufacture in-house, we can turn around a reorder faster than a trader waiting on a factory partner's schedule — letting you restock proven Category A sellers quickly without needing to over-order upfront as a buffer against slow supplier response.
Order a low-MOQ mixed lot to test your market velocity
📲 WhatsApp 9549322035Step-by-Step: Auditing Your Current Bedsheet Stock
Pull 6-12 months of sales data by SKU
Gather sales volume and revenue by individual print over the last 6-12 months to establish a real velocity baseline.
Rank SKUs by sales velocity
Sort every SKU from fastest-selling to slowest-selling based on units sold per period.
Assign Category A to your top volume drivers
Label your highest-velocity SKUs (typically core Sanganeri prints) as Category A — largest, most frequent allocation.
Assign Category B to mid-velocity performers
Label steady, moderate-volume SKUs (typically Bagru prints) as Category B — consistent but lower volume.
Assign Category C to low-volume premium items
Label slow-moving, premium SKUs (typically hand block prints) as Category C — minimal or made-to-order stock.
Set reorder rules per category
Reorder A frequently and generously, B moderately, and C only against confirmed demand to avoid dead stock.
Frequently Asked Questions
Test Your Market Velocity Today
WhatsApp us to order a low-MOQ mixed lot across Sanganeri, Bagru, and Dabu — test what actually moves in your market before committing to a larger order.